
Overview
The Dashboard is your agency’s control center. It gives you a view of voice usage, spend, and call outcomes, aggregated across all sub accounts for agency users, or scoped to one client for sub account users. Use the Year / Day / Week / Month toggle at the top to change the time range.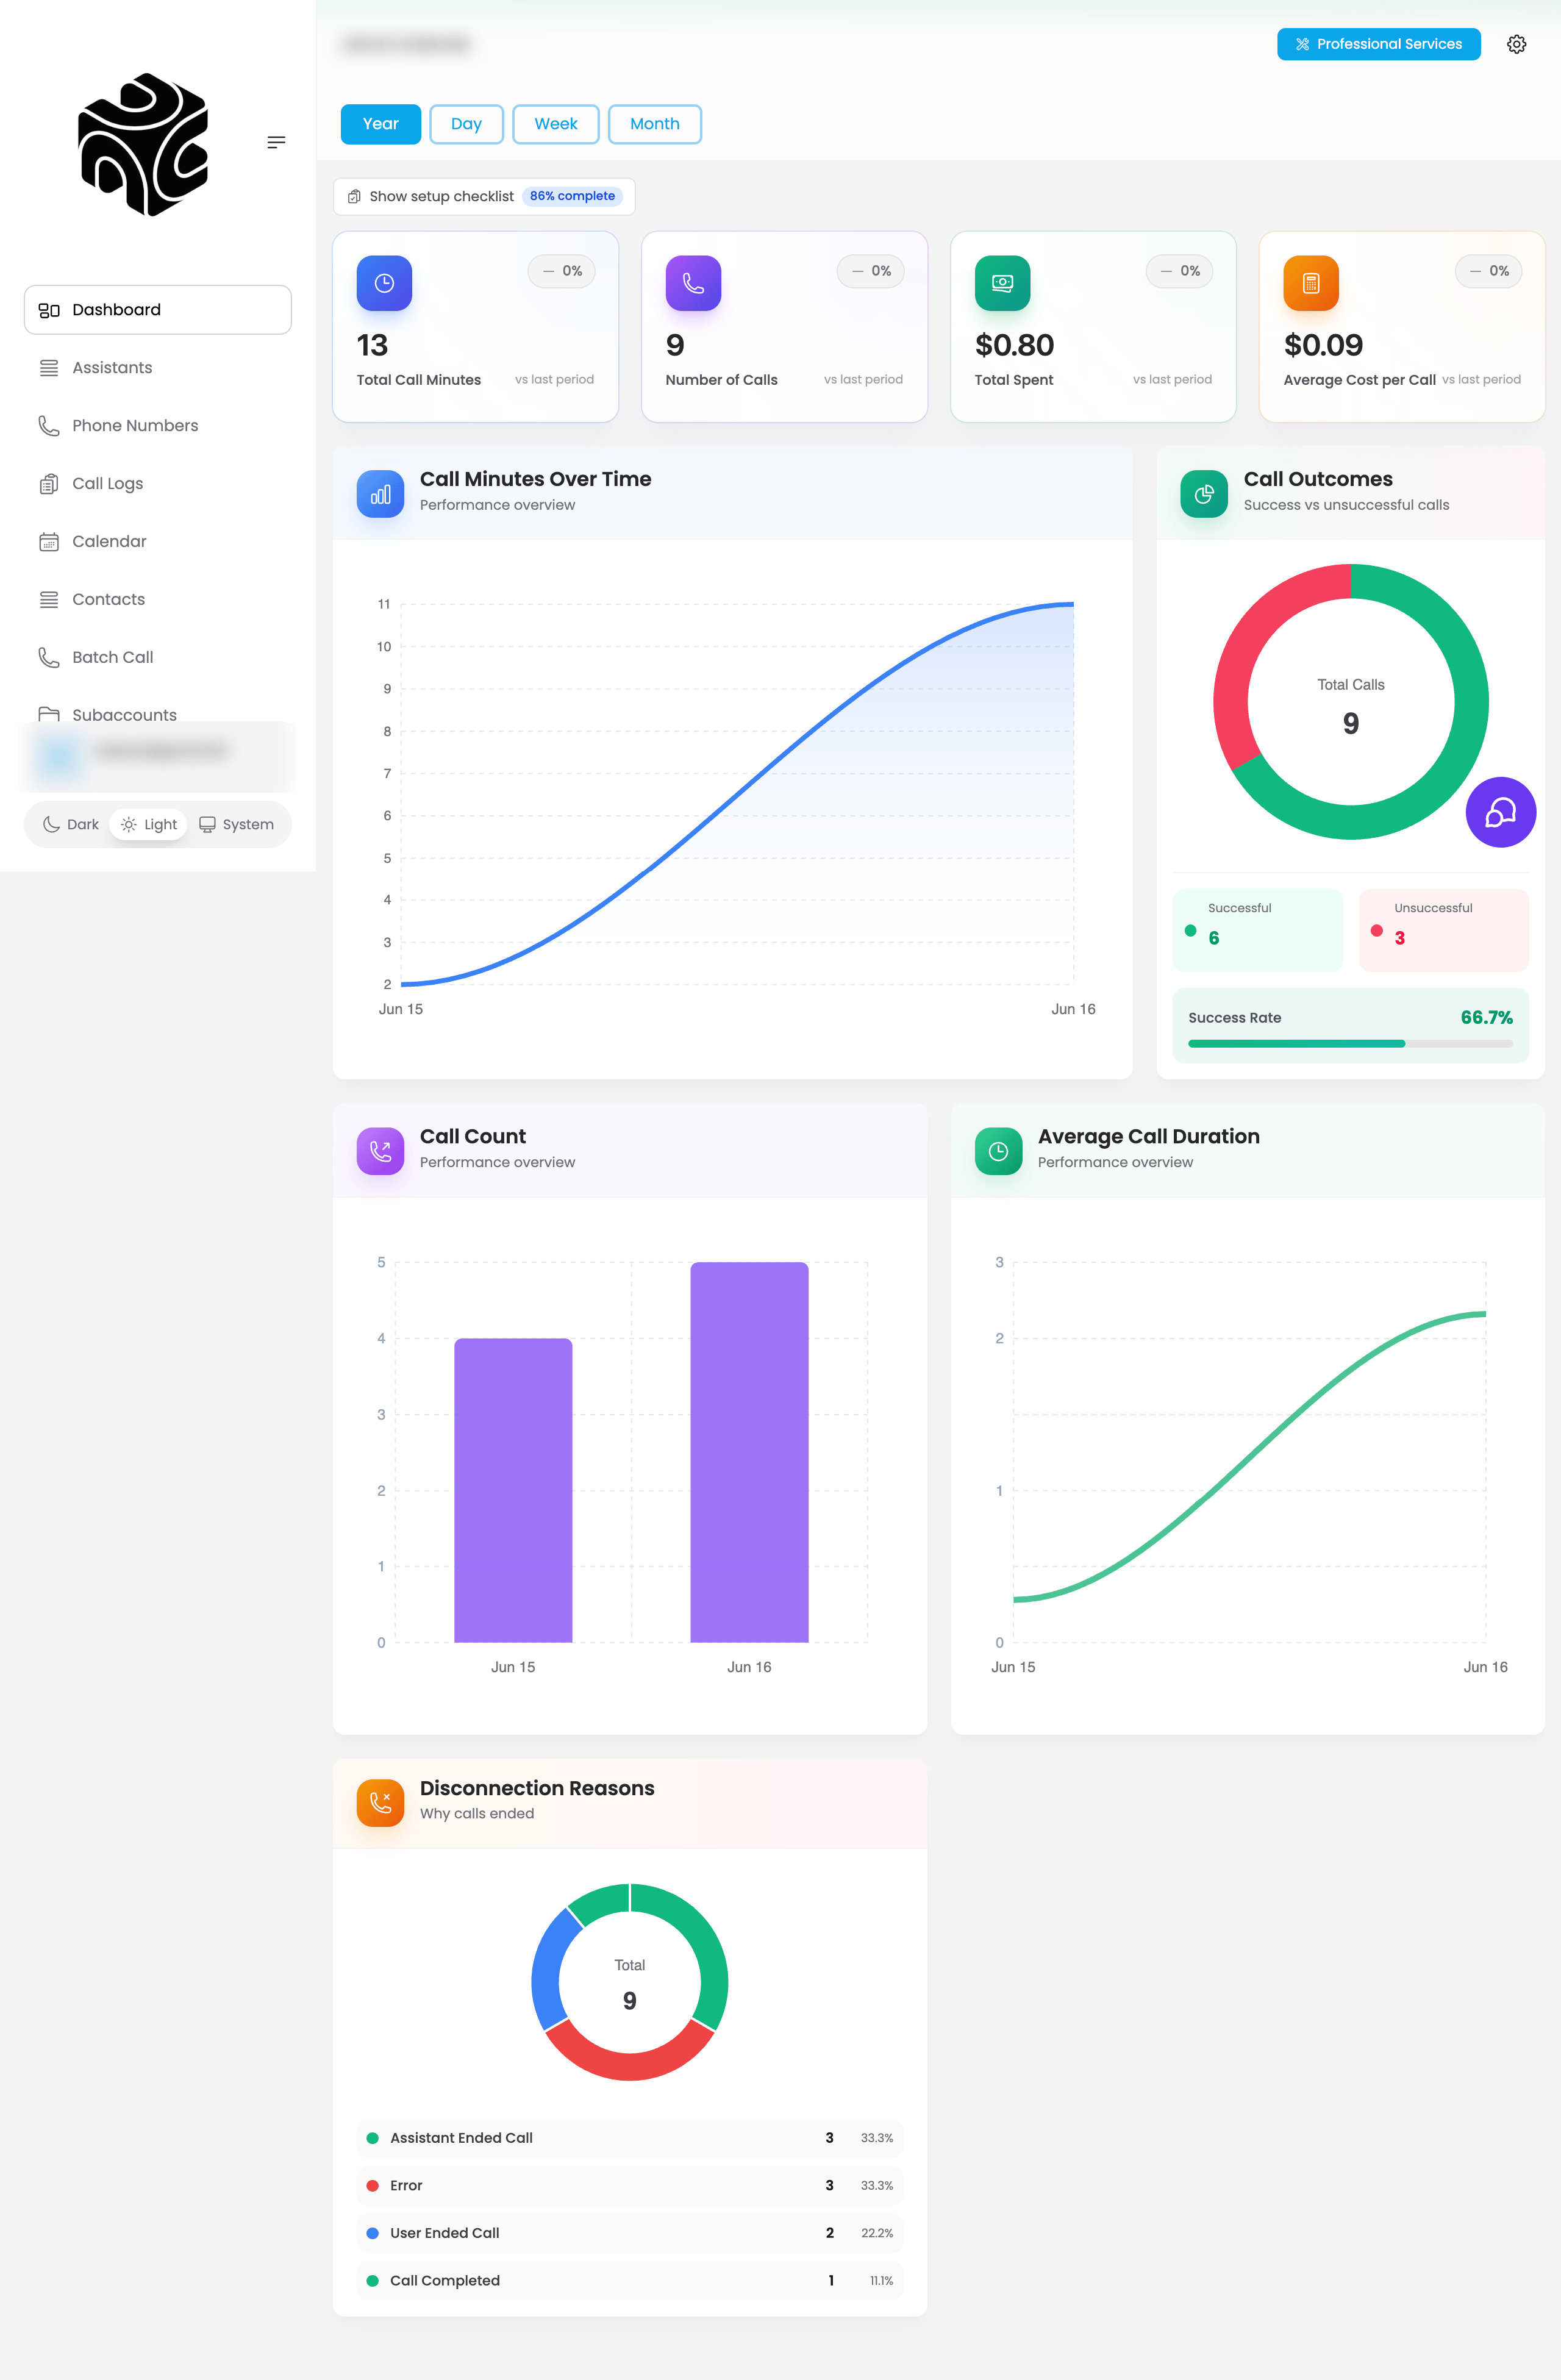
Summary tiles
Four tiles at the top summarize the selected period, each with a change indicator versus the previous period:- Total Call Minutes: voice-call minutes processed.
- Number of Calls: total calls made.
- Total Spent: your provider cost for the period.
- Average Cost per Call: total spend divided by call count.
Charts
- Call Minutes Over Time: minutes trend across the selected range.
- Call Outcomes: successful vs. unsuccessful calls, with a success-rate bar.
- Call Count: calls per day.
- Average Call Duration: average call length per day.
- Disconnection Reasons: why calls ended (e.g., assistant ended call, error, user ended call, call completed), with counts and percentages.
Reading the dashboard
Use these to spot usage trends and catch anomalies early. A spike in call count with a drop in average duration, or a rising share of Error disconnections, can indicate a misconfigured assistant worth investigating in Call Logs.Related Articles
- Call Logs: drill into the calls behind these numbers
- Usage: usage tied to billing and package limits
- Platform Overview: where the Dashboard sits in the sidebar