Dashboard Overview
The dashboard provides a comprehensive overview of your agency’s performance, displaying key metrics through three informative bar charts.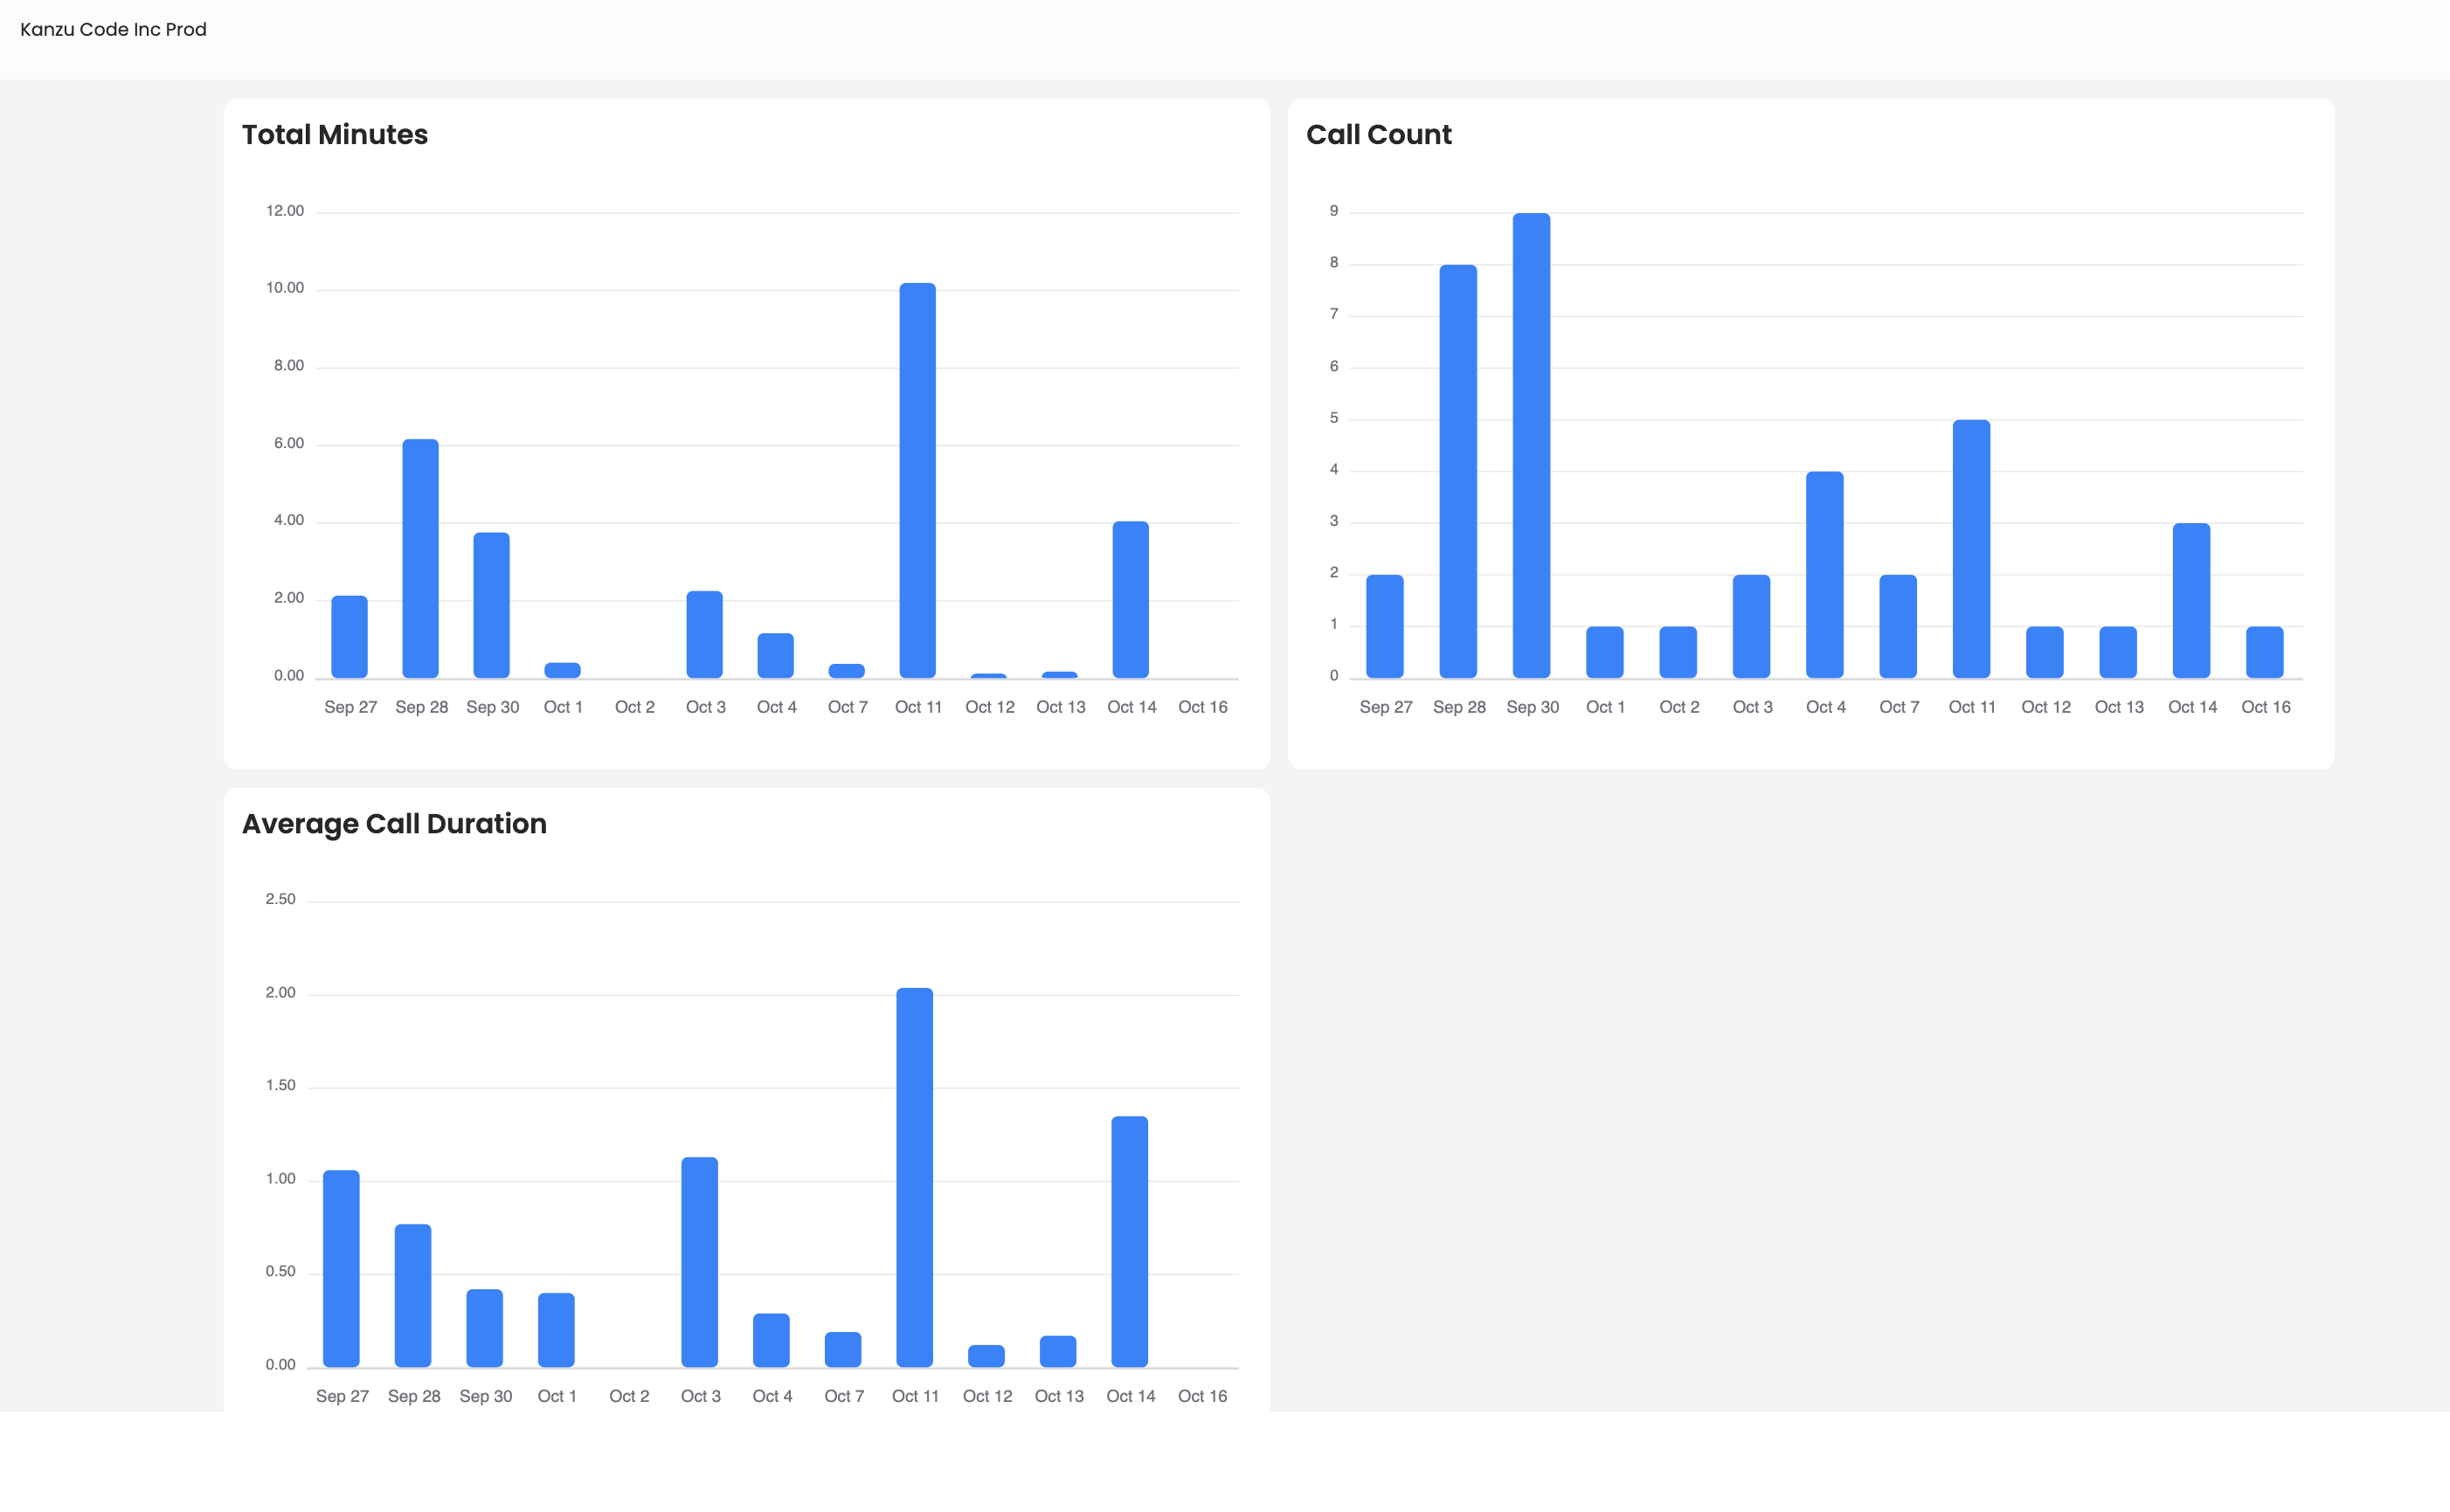
Key Metrics
-
Total Minutes per Day
- This chart displays the total minutes of voice calls processed each day. For agencies, the data combines all subaccounts, giving you a holistic view of usage. For subaccount users, it focuses solely on their specific subaccount.
-
Total Call Count per Day
- This chart shows the total number of calls made each day. Again, agency dashboards aggregate data from all subaccounts, while subaccount dashboards display the count for that particular subaccount.
-
Average Call Duration per Day
- This chart illustrates the average duration of calls processed each day. Agencies will see an aggregate of average durations across all subaccounts, while subaccount users will only see their respective data.